Evaluating "small" LLM performance for content extraction tasks
Setting Stage
Last year I finally decided to tackle one of the larger items on my todo list. I finally got around to organize my paperwork digitally. It is one of those tasks that probably everybody dreads but will make itself noticeable
every so often when you need to dig out some document, or new ones arrive and a decision needs to made if it is worth keeping or belongs in the bin.
Of course there are numerous SAAS products claiming to solve these problems for you, but me being me I wanted something I can host myself where my data would be under
my control. I had heard good things about paperless-ngx which is an open source solution for document digitization, so naturally when my
motivation to tackle this task finally reached its peak it was time to take a look. Right from the start there where a lot of things to like about it. I am not going to go into the details of its features suffice it to say the default feature set is very good and extensive.
But there was this one feature I really wanted to see before starting physical paper to digital software transition. Per default paperless-ngx can match documents to a set of correspondents and document types, as well as extract the document date.
This is basically the base set of information that is relevant for any kind of document. But depending on the document type, there might be more interesting information that you would like to extract. A classic example of this would be the invoice number and amount, but that kind of information is only relevant for an invoice. For this use case paperless-ngx supports attaching custom fields to documents. This process can also be automated by adding workflow rules that attach custom fields
to document on import. So you can create a rule that will attach a custom field for the invoice number and a custom field for
the invoice amount to every document that is classified as an invoice. But the thing that is missing is that by default it
is not possible for the software to extract this field automatically from the document content.
Naturally this missing feature was the perfect excuse to postpone my ambitions of digitizing my paperwork until I had come
up with a solution to this problem. Also it seemed like a good target to play around with this LLM technology everybody keeps
talking about. So win win … Some time later I released paperless-llm-workflows, it uses a relatively small language model to predict the values of unfilled custom fields from the document content and can be integrated automatically into the paperless-ngx workflows via a simple webhook. One of the big requirements I had was to not rely on any cloud providers or other services. The solution should be completely self contained. I since have expanded the features a bit more, but that is not why I am writing this blog post.
There came a point where I needed to make a decision what language model is best suited for the task. There are quite a lot of different pre trained open weights models available. In the beginning this was mostly a vibes based decision by me. I took a model and looked at the results of it performing a small set of extraction tasks. If it produced the correct results I stuck with it. But many models kind of perform okay at first glance. So what I really would like to do is actually evaluate the results across a larger set of documents and look at the statistics of the results rather than individual results themselves.
After the initial release I finally took the time to actually digitize my documents and import them into paperless. No more excuses, I needed a dataset. To make this process bearable I rented a duplex scanner with an auto feeder tray. I had setup the pipeline to attach custom fields and let my software predicts the values. So after importing the documents all I had to do was click through each document and check the results. The process is designed to be human in the loop, but having the values pre filled was a big time saver.
Benchmarking Architecture
With all my documents imported and verified I have a labeled dataset that I can use to do more advanced model and performance evaluation. So naturally the next step was to implement benchmarks. This task proved to be more work then anticipated. Ideally I just want to run multiple benchmarks in parallel in order to not have to remember to run the benchmark for every model individually, also I need a way to monitor progress.

paperless-llm-workflows uses llama-cpp for running the different language models, so in order to run multiple models for
benchmarking the easiest approach was to start a sub process per model. Which means the benchmarking code needs an orchestrator
process which loads the documents that are going to be used, It ensures all processes use the same set of documents and collects
the results and displays the progress in the tui (a great excuse to try the ratatui framework for building terminal uis …)
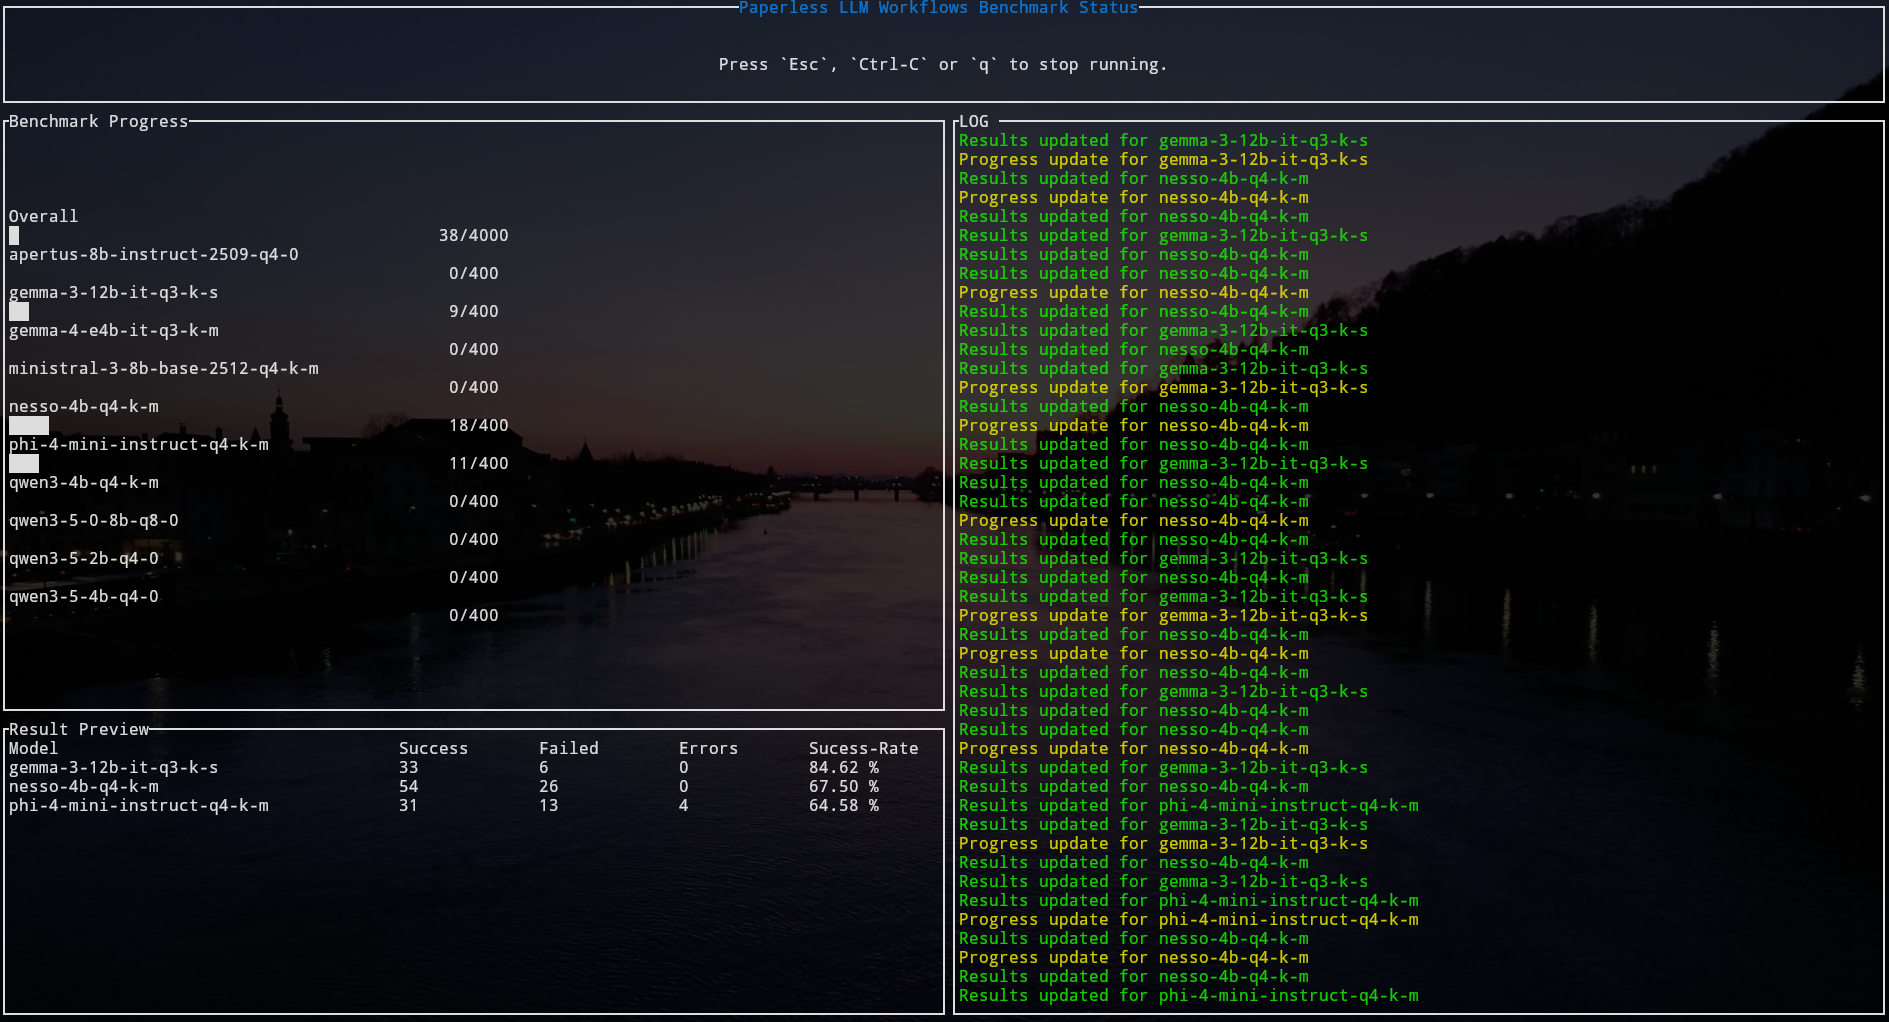
So this is what it looks like … When I start the benchmark all model (gguf) files that are found in the models directory will be queued. For each model a sub-process will be spawned, the number of parallel sub-processes is limited by a semaphore. This way I have a neat overview of the progress. Of course more detailed result information is written to a result json file for later analysis!
Right now for each document there are 3 kinds of tests implemented.
- Tests the model’s ability to extract and fill custom fields from document content. The model must match the exact value that was previously verified for the document.
- Tests the model’s ability to suggest the correct correspondent (author/sender) based on document content. The model’s suggestion is compared against the verified correspondent.
- Tests the model’s reasoning capabilities with true/false questions:
- “Is [verified correspondent] the author/sender of this document?” (should answer true)
- “Is [random other correspondent] the author/sender of this document?” (should answer false)
For each kind of test there are 3 possible outcomes:
- Success the result of the test matches the expected result
- Failure the result of the test is valid but does not match the expected result
- Error the result of the test is not a valid result (could not be parsed)
The tui just shows the overall results, but the result json actually tracks these results for each kind of test individually.
Benchmark Results
Before diving into the result I want to take a moment to talk about the goal and how that influenced my selection of models.
- I want a model that produces the correct results (duh obviously)
- I want this model to be as small as possible, so I can ship it with the default container and keep the container size manageable!
The second requirement also meant I am mostly looking at open weights models that are released under a permissive license. Another reason I want to keep the model small is that, smaller models generally require less compute to run thus enabling a broad set of potential user to actually consider my solution without investing into expensive hardware! So how big are we talking about? A couple of gigabytes at most!
This is mostly achieved by using quantized version of the models. The results of the benchmark thus also only apply to the quantized version I used. I would not try to extrapolate from this too much to the full weights version. Of course they might behave similarly, but this “might” is just that. Any serious evaluation of the full weights model would need to use the full weights version!
4,4G    models/Apertus-8B-Instruct-2509-Q4_0.gguf
5,1G    models/gemma-3-12b-it-Q3_K_S.gguf
3,8G    models/gemma-4-E4B-it-Q3_K_M.gguf
4,9G    models/Ministral-3-8B-Base-2512.Q4_K_M.gguf
2,4G    models/nesso-4b-q4_k_m.gguf
2,4G    models/Phi-4-mini-instruct-Q4_K_M.gguf
2,4G    models/Qwen3-4B-Q4_K_M.gguf
769M    models/Qwen3.5-0.8B-Q8_0.gguf
1,2G    models/Qwen3.5-2B-Q4_0.gguf
2,5G    models/Qwen3.5-4B-Q4_0.gguf
I don’t want to compromise on performance to much just to keep the model small, but a bigger model needs to justify it’s weight!
First lets take a look at the raw numbers, the histogram shows the result of each test performed overall and for each kind of test individually.
In the top row, the results for the custom field filling are shown, because documents may have more than one custom field it is expected that this test was performed more often then the other three. Generally most models do pretty well at this test.
The second row show the test where the model suggest a correspondent from the list of allowed corresponents for the document based on its content alone. Generally models are not great at solving this task. More on that later.
The third and forthed row depict the results for the third test. The third row depicts the test where the model is expected to verify the correct correspondent and the forth row depicts the case where the model is expected to falsify the invalid correspondent. Since these to result rows are to sides of the same basic test, there results should be considered together rather than individually. I model that always says no and never yes to the correct results is just as bad as the inverse situation. For a model to perform well the results should be good in both tests at the same time!
The last row shows the accumulated results over all test cases.
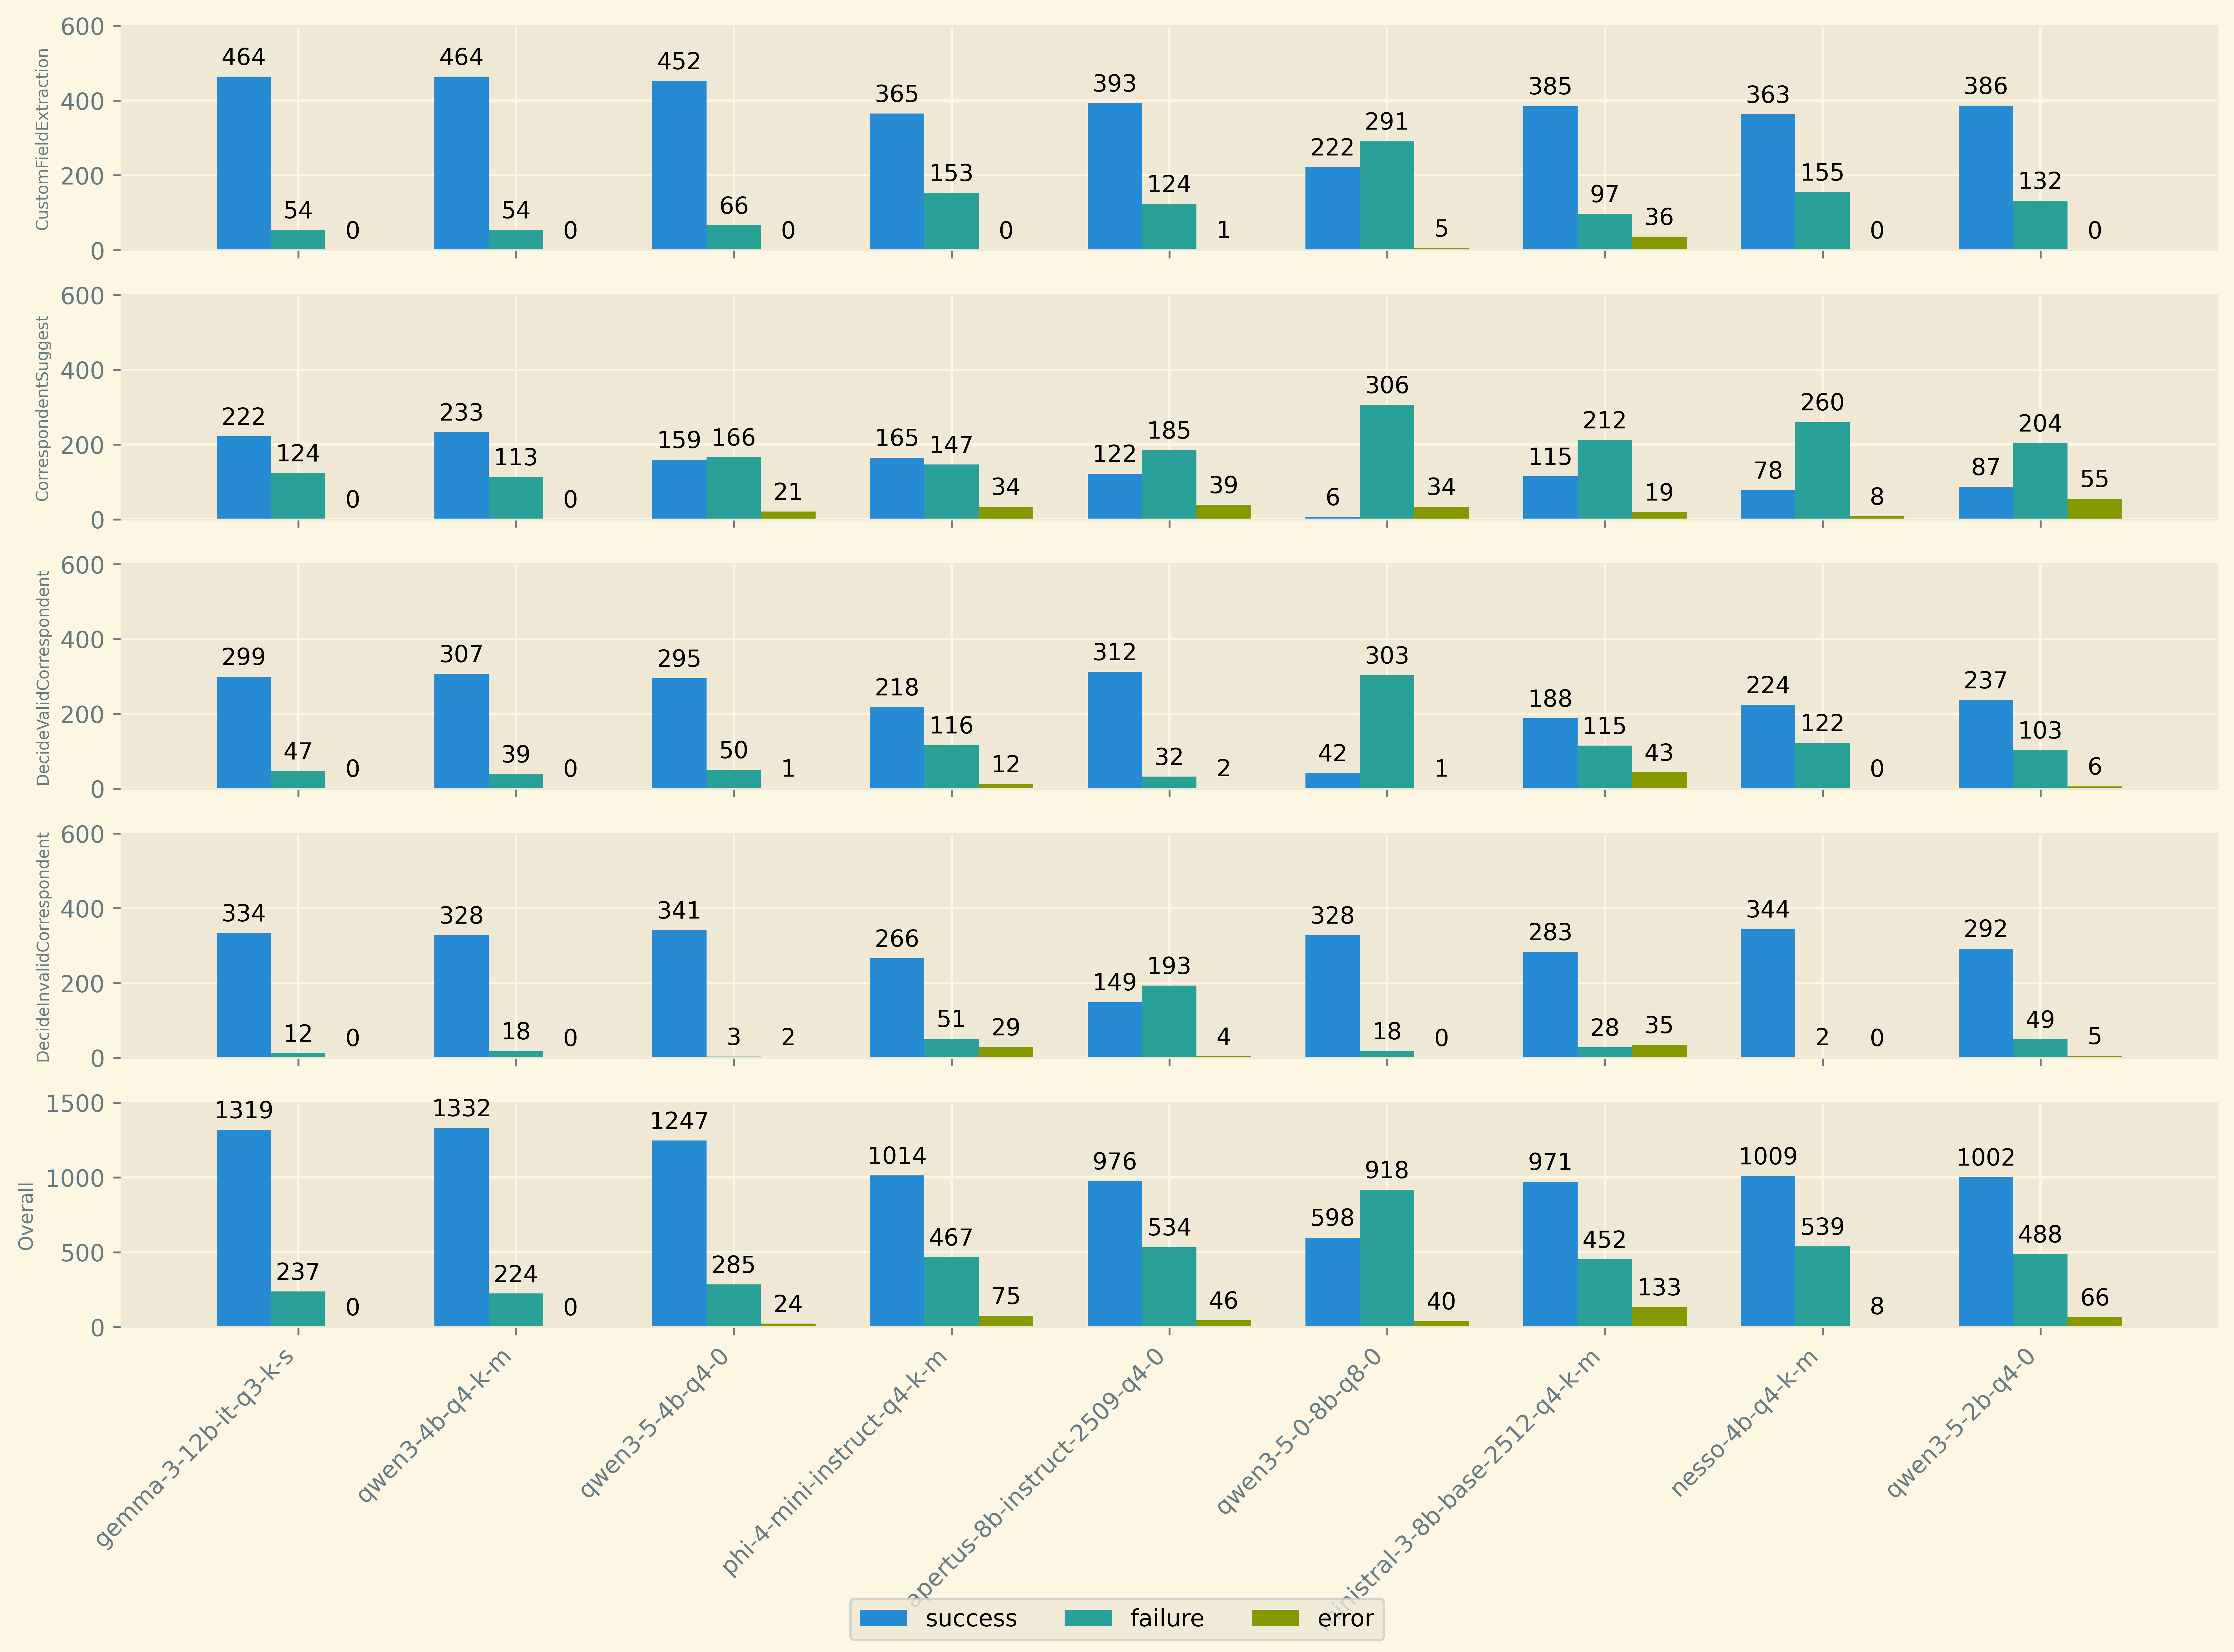
I like this depiction because it more accuratly highlights the difference between the model producing non sensical output (error) and failing to provide the correct response.
Models with higher error rates are less reliable even if otherwise the results are good. For example I quite liked the output of ministral during manual testing, but I did
not encouter the errors here, just because they did not appear in my limited time for manual testing.
Generally speaking the models that perform great on all individual test also perform the best overall. But the histogram is complex to process so the following table takes the individual tests and condenses the results into a single number, the success-rate the results are ordered from worst performing to best performing overall.

This gives a much more focused overview of the results. The smallest model is as expected the worst performing one. But more interstingly the biggest model is not the best performing! qwen3-4b outperforms gemma3-12b a model with 3 times the amount of parameters and in terms of physical space more than twice it’s size in bytes. Another intersting observation is that qwen3.5 is not performing better than qwen3, so the newer model is not always better than the older one.
So the winner clearly is qwen3-4b and it also has a very permissive license so I am going to update my default container very soon ;)
Conclusions and Future Work
Overall I would say that this was a fun exercise even though it took me quite some time to get all this set up. But keep in mind I am doing this in my spare time (of which
there is little). Apart from the obvious winner of the benchmark there are some more nuanced learnings I would like to share.
The biggest and newest model is not always the best for the task at hand. There is just no way around evaluating models on the task you want to use them for directly. In the beginning this might mean manual vibes based selection. But then there is no way around gathering a labeled dataset for your task and doing actual performance evaluation! Otherwise you are just guessing/praying that the model behaves well in most cases. And given that these models come with quite some amount of unpredictabilty the only real way to manage that is statistics.
This benchmark is not just about the model, it is also about my code. Future changes to the way I am instrumenting the models to perform the desired tasks will need to withstand the same benchmark. If changes to the way the models are used do not result in better accuracy then they are pointless. In a way this allows me to quantify not just the model performance but how I well I am using the context space. An obvious candidate from improvement is the correspondent suggestion task. It seems models across the board struggle here, so a better strategy should result in better results accross the board.
I am not yet decided on how model independent llm based projects actually are. There are just so many variables that can be adjusted and each model might be tuned to these variables differently. Things like the default temperature, min-p, top-k and so on. Right now I am using the same sampling parameters for each model, but if the parameters I selected are the best for each model individually is unclear. Also different steps during inference might benefit from differently selected parameters. For example during reasoning, a higher temperature might be better, but during selection of the final value a greedy approach might lead to better results overall. Taking the sampling pipeline into your own hands gives a lot of power, but also a lot of room that needs to be explored if you truely wish to get the most out of it.
The attentive reader might have noticed that gemma-4-e4b is missing from the results, but is mentioned in the model listing. I actually did perform the benchmark with it,
but the result have raised my suspicions that there is still some issue with it or llama-cpp. The model has only been out a couple of days and I am going to give it the
benfit of the doubt here. I just want to make sure there is no issue on my end before I publish the results. They are bad in a way I did not expect, which leads me to conclude
that I should let the ecosystem adjust first. Sadly in LLM land things move fast and break things faster … I will be updating this post with the results for it in the future.
End
If you like this post or have thoughts to share, feel free to reach out to me! I am always open to disussing my work!